Why does Chrome use so much memory? Activity Monitor can show Chrome RAM usage near the top of the list while you have only a few windows open. The number is worth investigating when your Mac slows down, but it’s not a diagnosis by itself.
Short answer: Chrome uses memory for the pages and extensions you run, plus the separate processes that isolate browser work. That separation supports security and keeps some crashes contained, but each process has overhead. Open Chrome Task Manager with Shift+Esc, sort by Memory footprint, and check the JavaScript memory and Process ID columns before closing anything. On a Mac, judge the system by Activity Monitor’s Memory Pressure graph and your actual slowdowns, not by free RAM alone. Settings and behavior below were checked November 8, 2026.
Why does Chrome use so much memory?
Chrome runs browser interface, web pages, extensions, graphics, and other services in separate processes. More processes can mean more memory, while a demanding page can use far more than a quiet one.
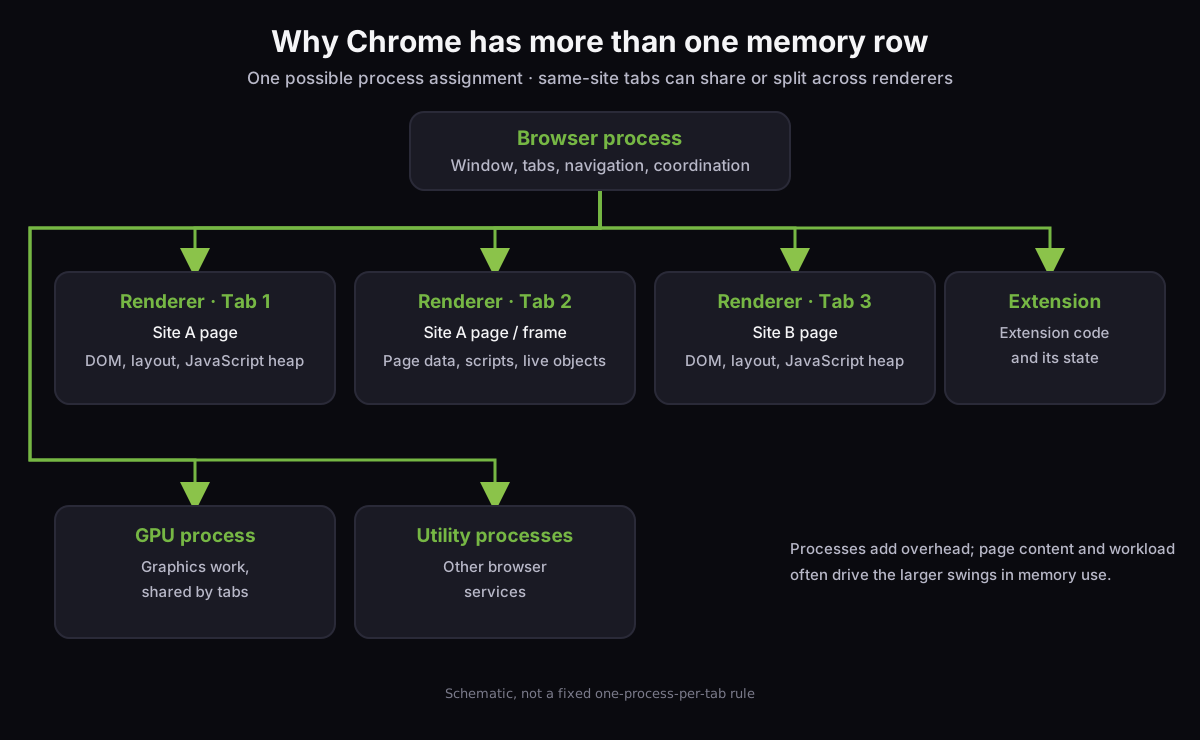
The diagram is one possible process layout, not a promise of one process per tab. Chrome’s browser architecture guide says the browser process coordinates work; renderer processes run page content; and GPU, extension, and utility processes handle other tasks. Chrome can put pages from the same site into one renderer, and cross-site frames can need their own process.
Processes keep private memory, so some common browser infrastructure, including V8, can be duplicated instead of shared. Site Isolation adds separation between sites for security.
Chromium’s published estimate is about 10–13% overhead on desktop Chrome 67 when isolating all sites with many tabs open; it’s a historical measurement, not a prediction for your current session. See Chromium’s Site Isolation notes.
The page itself can be the larger variable: what a renderer holds depends on what the page runs. A growing page may also retain memory as you use it. Chrome’s memory debugging guide says there’s no universal amount that counts as too much: the same page can behave differently on different devices.
How do I read Chrome Task Manager to tell whether memory use is a problem?
Use Chrome Task Manager to find the browser task, then use macOS Activity Monitor to see whether the whole system is under pressure. A large Chrome total without slowdowns or rising memory pressure doesn’t prove a leak.
- In Chrome, press
Shift+Escor choose ⋮ → More tools → Task manager. - Click Memory footprint to sort from highest to lowest. Right-click the column headings and enable JavaScript memory and Process ID.
- Compare the two memory columns. Memory footprint is the operating system’s memory for that task. JavaScript memory shows the page’s JS heap; its live value, in parentheses, tracks reachable objects. The Chrome DevTools guide explains what each column shows.
- On macOS, open Activity Monitor and select its Memory tab. Check Memory Pressure and Swap Used as you reproduce the slowdown. Apple says the pressure graph reflects free memory, swap rate, wired memory, and cached files; its Activity Monitor guide explains the other totals.
Use this rule: if Chrome is high but pressure remains low and the Mac responds normally, keep working. If pressure is high, swap is growing, or the machine pauses, sort Chrome’s tasks and test the biggest suspect. Apple’s memory-footprint overview also cautions that footprint includes compressed and swapped pages, as well as CPU and GPU objects on Apple silicon.
How can I reduce Chrome memory usage without losing work?
Change the largest identifiable cause first. Close or reload a disposable tab, disable an unnecessary extension, or let Memory Saver deactivate background tabs; then check whether pressure and responsiveness improve.
| What Task Manager shows | Check | First fix |
|---|---|---|
| One tab dominates Memory footprint | Does its memory keep rising while you use it? | Save your work, then reload that page. If it grows again, inspect it with the DevTools Memory panel. |
| JavaScript memory keeps rising | Is the live value still higher after the page has settled? | Use a Performance recording or heap snapshot to find retained objects; report the issue to the site if the growth repeats. |
| An extension row is unusually large | Does the same workload stay lower with that extension disabled? | Open chrome://extensions, turn it off, and compare. Remove it if you do not need it. |
| Many background tabs remain active | Are the pages needed right now? | Enable Memory Saver, or close tabs you no longer need. Keep essential sites on its exception list. |
| GPU Process is high during one page | Does the increase happen with a video, game, or graphics-heavy page? | Close that page or test it without the workload. Chrome describes the GPU process as separate from any single tab, so its row may not point to one page. |
If you’re troubleshooting a specific site, chrome://process-internals shows whether Site Isolation is active and how frames map to processes; Chromium documents it in its Site Isolation guide. Use it to understand process assignment, not to disable isolation as a memory fix.
Avoid ending a process just because its name is unfamiliar. End a tab task only after saving work and confirming it’s the one you want to close. Disabling an extension from chrome://extensions is easier to reverse than terminating its process.
Does Chrome Memory Saver actually free memory?
It’s designed to. Memory Saver deactivates background tabs and reloads a tab when you return to it. Its settings offer Moderate, Balanced, and Maximum levels; Google’s help page doesn’t give an idle-time threshold for each level, so judge the result in Activity Monitor rather than expecting a fixed saving.
As checked November 8, 2026, open ⋮ → Settings → Performance → Memory Saver. Choose Balanced to start; use Maximum if you prefer earlier tab deactivation, or Moderate if you want inactive tabs to stay available longer.
Add a site under Always keep these sites active if it must not be deactivated. Google lists active audio or video, screen sharing, page notifications, downloads, partially filled forms, pinned tabs, and connected devices among the conditions that can prevent deactivation. These controls are documented in Google Chrome Help.
Save form work before relying on deactivation. It only acts on background tabs, so a page that grows while you’re using it needs the checks in the table above.
Energy Saver is a different control. Google says it reduces image capture rate and background activity to extend battery life, and may stop eligible CPU-intensive background tabs. It’s not the setting to choose when your only goal is freeing memory.
Safari vs Chrome on Mac: does Safari use less memory?
There’s no useful universal winner: memory changes with the sites, extensions, media, and tabs in a comparison. Safari and Chrome both use multiple processes, so process count alone doesn’t tell you which uses less RAM.
WebKit’s process architecture documentation describes a UI process, WebContent processes for web pages, and a shared networking process. It says each Safari tab typically has its own WebContent process. Chromium’s model also separates pages and browser services, and can allocate processes by site and cross-site frame. In WebKit vs Chromium, both designs spend memory to isolate some work; neither makes a per-tab memory number comparable across engines without the same workload and measurement method.
For your own choice, open the same sites in both browsers, use the same tabs and extensions, wait for pages to settle, and compare Activity Monitor’s total memory pressure over the same interval. Treat one run as a snapshot. If the difference matters, repeat it with your real workload. We have no controlled Safari-versus-Chrome measurement to claim a typical saving.
What does tab hibernation look like in Octoweb?
We build Octoweb, a WebKit-based Mac browser. Its tab hibernation is one concrete policy for deciding which background page to unload; it’s not evidence that it uses less memory than Chrome.
Octoweb samples system memory pressure every two seconds. At 10–20% available memory, it hibernates one background tab per pass; below 10%, it hibernates three. Its victim score weights idle time at 70%, sampled process memory at 20%, and recency at 10%, while protecting the active tab, media-playing tabs, and agent-driven tabs.
On an 8 GB Mac, the defaults are 600 seconds for frozen state, 180 seconds for cold state, six background tabs, and 250 MB; an idle tab over 1,500 MB after a minute also trips the runaway guard. These are Octoweb’s implementation choices, not universal browser thresholds or measured savings. See our Octoweb introduction for the browser’s broader design. For browser automation comparisons, see our Chrome DevTools MCP guide.
When Chrome’s number surprises you, start with its labeled task list and the system pressure graph. If one task is responsible, fix that task; if the whole machine is under pressure, use Memory Saver for tabs you can reload and keep essential work active.
— Don
If you want to inspect how a browser implements these choices, Octoweb is open source; report a memory issue with your macOS version, browser version, and the steps that reproduce it.