You need an agent to inspect a broken page or repeat a browser flow. Pick by whether you need Chrome debugging, cross-browser coverage, or shared account state.
Short answer: Choose the Chrome DevTools MCP server when the job depends on Chrome debugging: performance traces, Lighthouse, heap snapshots, CSS rules, or network details. Choose the Playwright MCP server when you need Chromium, Firefox, or WebKit coverage, reusable Playwright code, or explicit test-oriented capabilities. In our two-run Claude Code measurement on November 8, 2026, Chrome DevTools MCP 1.12.0 exposed 32 deferred tool definitions costing 10,972 tokens; Playwright MCP 0.0.84 exposed 25 costing 6,747. That counts definitions only, not the page snapshots or tool results your task returns.
What does Chrome DevTools MCP do compared with Playwright MCP?
Chrome DevTools MCP is centered on Chrome’s debugging interface; Playwright MCP exposes Playwright’s browser automation API across several engines.
| Decision factor | Chrome DevTools MCP 1.12.0 | Playwright MCP 0.0.84 |
|---|---|---|
| Browser control | Chrome, driven through Puppeteer according to the project README | Playwright driver; browser can be Chromium, Firefox, WebKit, or Microsoft Edge |
| Page state for the model | take_snapshot returns a text snapshot of the accessibility tree with unique element IDs; screenshots are available for visual state |
browser_snapshot returns structured accessibility state with element references; screenshots are available when visuals matter |
| Debugging tools | Performance trace and insights, Lighthouse, heap snapshots, matched CSS rules, console, and network request details | Console and network tools; optional capability groups add tracing, testing assertions, storage, and more |
| Automation-only edge | Chrome-specific DevTools access, including Lighthouse and heap inspection | Browser selection, Playwright code execution, persistent or isolated contexts, and Playwright Extension attachment |
The tool list in the table is version-sensitive. The counts below are pinned to the measured versions; capability and flag descriptions use project docs checked November 8, 2026. Chrome DevTools MCP’s tool reference names the trace, audit, heap, CSS, and network tools; Playwright’s MCP documentation describes browser selection, snapshots, and optional capabilities.
Chrome DevTools MCP also enables tool usage statistics by default, and performance traces may send URLs to Google’s CrUX API. If you don’t want either behavior, add --no-usage-statistics and --no-performance-crux to its launch arguments, as documented in the project README.
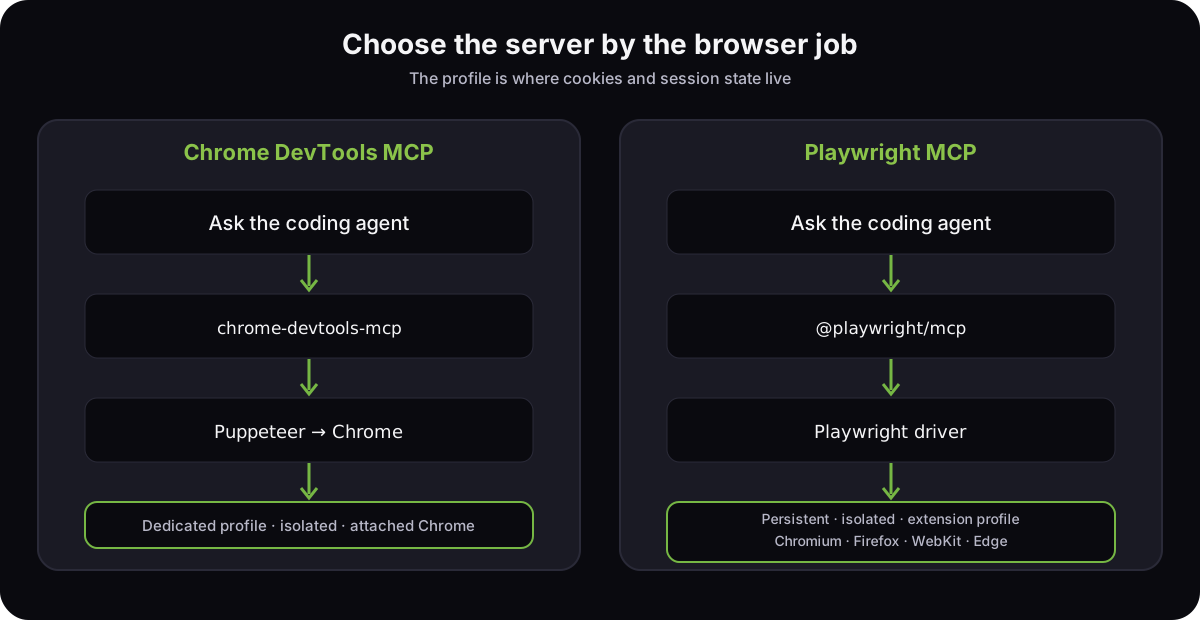
Use the browser’s own state representation as a practical tie-breaker. For a layout bug, a screenshot helps the agent see pixels; for form navigation, an accessibility snapshot gives it named controls and references. For a Chrome-only performance investigation, start a trace and inspect its insights rather than asking a generic browser automation tool to approximate DevTools.
How much context does each browser MCP use?
In a controlled pair of runs, Chrome DevTools MCP’s definitions used 4,225 more tokens than Playwright MCP’s definitions. That difference is useful when choosing a tool surface, but it isn’t a prediction of total task tokens.
We ran each server twice through Claude Code 2.1.319 with an empty project, model Claude Opus 5.5, one server configured, and tool search enabled. Both runs for each server returned identical values:
| Server version | Tools | Deferred definition tokens | Largest definition |
|---|---|---|---|
| Chrome DevTools MCP 1.12.0 | 32 | 10,972 | emulate, 943 tokens |
| Playwright MCP 0.0.84 | 25 | 6,747 | browser_take_screenshot, 553 tokens |
The definitions appeared in Claude Code’s deferred MCP row, so they were available for tool search rather than loaded into the initial model context. We counted the tool schemas and descriptions; we did not measure result tokens, screenshots, latency, or task success. A screenshot or long snapshot can dominate the definition difference on a real task. For a repeatable method to separate those costs, see our MCP token measurement guide.
Does each server use my signed-in browser profile?
By default, neither server controls your everyday Chrome window. Each starts or reuses a profile it owns; attachment to a running browser is an explicit mode with different state and security consequences.
| Profile mode | What happens to cookies and state | When it fits |
|---|---|---|
| Chrome DevTools MCP default profile | Launches Chrome with a dedicated profile under ~/.cache/chrome-devtools-mcp/; it persists between runs and is separate from regular Chrome |
Repeated testing in a stable agent-only account |
Chrome DevTools MCP --isolated |
Creates a temporary profile and removes it when Chrome closes | Clean reproduction or CI-like runs |
Chrome DevTools MCP --autoConnect |
Connects to a running Chrome 144+ profile after remote debugging is enabled and you accept the permission prompt | Share state between manual testing and the agent |
| Playwright MCP default profile | Keeps a separate profile per workspace between sessions | Repeated tests without using your everyday browser |
Playwright MCP --isolated |
Starts each session with fresh state; use --storage-state to seed it |
Reproducible flows with controlled authentication |
| Playwright Extension mode | Attaches to the tabs in a browser where the extension is installed | Agent needs a currently open browser tab and its session |
For Chrome DevTools MCP, the project’s advanced usage guide explains the persistent default profile, --isolated, and attachment through --autoConnect or --browser-url. The Playwright MCP setup guide documents its persistent, isolated, and extension modes. If your main goal is using Claude inside an existing Chrome session, our Claude in Chrome guide covers that separate workflow.
Attaching to a real Chrome profile gives the agent access to the tabs and account state in that profile. Chrome’s guide requires a non-default user-data directory for a remote debugging port and warns that any local application can control a browser while that port is open. Keep personal accounts out of a debugging profile, and turn remote debugging off when the session ends.
How do I add Chrome DevTools MCP or Playwright MCP to Claude Code or Codex?
For Claude Code, register a local stdio server with claude mcp add; for Codex, add a [mcp_servers.<name>] table to ~/.codex/config.toml. These four snippets are docs-only: they’re based on client and server docs and were not run as part of our measurement.
The command lines below use a POSIX shell on macOS or Linux. Pin the package version if you want the same tool catalog we measured. Chrome DevTools MCP requires Node.js LTS, npm, and current stable Chrome; Playwright’s guide requires Node.js 20 or newer and supports Chrome, Firefox, WebKit, and Edge. The Chrome project documents a separate Windows 11 config using cmd /c npx in its client setup guide.
Chrome DevTools MCP in Claude Code:
claude mcp add --scope user chrome-devtools -- npx -y [email protected]
Playwright MCP in Claude Code:
claude mcp add --scope user playwright -- npx -y @playwright/[email protected]
Chrome DevTools MCP in Codex, in ~/.codex/config.toml:
[mcp_servers.chrome-devtools]
command = "npx"
args = ["-y", "[email protected]"]
Playwright MCP in Codex, in ~/.codex/config.toml:
[mcp_servers.playwright]
command = "npx"
args = ["-y", "@playwright/[email protected]"]
The Claude Code MCP reference documents the claude mcp add <name> -- <command> pattern, and Codex’s MCP guide documents the TOML fields. The Chrome DevTools project lists both client-specific setup forms in its client configuration guide.
After adding one server, check claude mcp list and /mcp in Claude Code, or codex mcp list in Codex. A configured server should appear in the list; then ask it to navigate to a local development URL and read the page title. If that works, remove it with claude mcp remove <name> or codex mcp remove <name> when you’re done.
What errors do people hit when connecting the Chrome DevTools MCP server?
Most connection failures are a mismatch between the browser and the server process: the browser can’t launch in its environment, or the MCP server can’t attach to the intended Chrome session.
| Symptom | Likely cause | Fix to try |
|---|---|---|
Chrome failed to start in a container or OS sandbox |
Chrome needs sandbox permissions the MCP process does not have, or the process runs as root | Run the server as an unprivileged user; if the MCP client sandbox blocks Chrome, start Chrome outside it and connect with --browser-url |
ProtocolError: Network.enable timed out with --autoConnect |
Chrome is below 144, remote debugging is off, the consent prompt was not accepted, or another server is using the same port | Enable remote debugging at chrome://inspect/#remote-debugging, accept the prompt, and close duplicate MCP sessions on that endpoint |
MCP client ... failed to start: request timed out |
In one 2025 Codex report, the server did not start under an older Node installation | Check that npx [email protected] --help works in the same terminal; use a supported current Node LTS, then reconnect |
The first two fixes come from Chrome DevTools MCP’s troubleshooting guide. For the timeout, a reported Codex issue says switching to Node 22 fixed that reporter’s startup failure; it’s a dated report, not a guarantee that every timeout has the same cause. In a later Network.enable timed out report (issue #1763), the maintainer pointed to frozen or discarded tabs in the attached Chrome, so check for sleeping tabs before blaming the port.
If Chrome itself launches but your signed-in pages are missing, check the Chrome DevTools MCP profile mode and server arguments first: use its dedicated persistent profile, or deliberately attach to a running browser. For Playwright MCP, verify --browser, --user-data-dir, --isolated, or --extension against the state you expect.
Which browser MCP should I choose for debugging or automation?
Choose by the browser and evidence your job needs. Keep a regular Playwright test suite for repeatable CI assertions; use an MCP server when an agent needs to explore a page or diagnose a live state.
| Pick | When it fits | Tradeoff |
|---|---|---|
| Chrome DevTools MCP | Chrome-only debugging, performance traces, Lighthouse, CSS cascade inspection, or heap analysis | Chrome-specific, and its measured deferred definitions were 4,225 tokens larger than Playwright MCP’s |
| Playwright MCP | Cross-browser checks, accessibility-based interaction, reusable Playwright code, or controlled storage state | Chrome DevTools-specific diagnostics are not its center of gravity; opt into extra capabilities only when the workflow needs them |
| A browser with built-in MCP | The agent needs to work in your everyday, already logged-in browser session | Browser and platform choice narrows; treat the session as a privileged tool surface |
We build Octoweb, a macOS browser with an MCP server that drives its own logged-in workspace. Version 0.21.0 exposes 44 MCP tools over loopback HTTP; each workspace keeps its own cookies and local storage. It’s an option when keeping the human and agent in the same browser workspace matters more than choosing Chrome, Firefox, or WebKit. See how we introduced Octoweb.
For a Chrome web app bug, use Chrome DevTools MCP and keep its default profile separate unless you need to share a test session. For a Firefox or WebKit run, a reusable test snippet, or an accessibility-first form flow, use Playwright MCP. For a human-and-agent shared session, choose a browser built around that workspace model and limit what the agent can reach.
— Don
Try one representative debugging task with a dedicated browser profile, then compare the returned evidence and context in your own agent. Open an issue on GitHub with the workflow you want us to cover next.